


Ontario casino games divide into slots, blackjack, roulette, live dealer tables and a newer shelf of game shows. We counted 6,064 titles in one licensed lobby on the date of this article: 85.9% were slots, the category with the lowest average return.
That imbalance is the single most useful thing to know before you open a lobby. The shelf that fills the screen is not the shelf that pays best, and the gap is not small. This page counts what is actually in an Ontario catalogue, category by category, and explains what each type of game returns over time. For a ranked view of the operators themselves, see our ranking of the best online casinos in Ontario.

888 Casino


Jackpot City


Bet365


Betway



Betano

Spin Genie
Spin Casino

SlotsMagic

PowerPlay

Play Ojo
On this page
Casino Games in Ontario at a Glance
Every figure below is counted, not estimated. Read the shelf you care about, or take the whole table as the shape of a licensed Ontario lobby.
| Shelf | Titles | Average RTP | Best suited to |
|---|---|---|---|
| Slots | 5,211 | 93.70% | Small stakes, the widest choice |
| Blackjack | 380 | 99.04% | The lowest long-run cost, if you learn the strategy |
| Live dealer tables | 512 | 98.46% | A human dealer; higher table minimums |
| Baccarat | 77 | 98.29% | One decision per hand, low edge |
| Roulette | 92 | 97.22% | Simple bets, nothing to learn |
| Game shows | 54 | 96.79% | Watchability over return |
| Crash games | 28 | 95.02% | Very short rounds |
| Progressive jackpots | 132 | 93.83% | A large prize, funded by a weaker base game |
The overlap in that last note is the reason two numbers on this page look like they disagree and do not: 512 titles are streamed with a live dealer, but only 145 sit in the platform’s own Live Casino family, because most of the rest are filed under blackjack and roulette.
The Best Casino Games in Ontario, by Priority
There is no best category, only categories that suit different priorities. Set the priority first and the shelf follows.
| If your priority is… | Best-suited shelf | What the count says |
|---|---|---|
| The lowest long-run cost | Blackjack | 99.04% across 380 tables — but only with correct basic strategy |
| Low cost with no decisions | Baccarat or European roulette | 98.29% and 97.30%; nothing to learn beyond which side to back |
| The longest session per dollar | Low-volatility slots | Just 4.4% of the catalogue — the rating is on the game panel |
| A human dealer and atmosphere | Live tables | 98.46% average, but a median table minimum of $5.00 |
| Trying a game before depositing | Demo mode | 3,964 titles — 65.4% — run without money |
| A very large single prize | Progressive jackpots | 132 titles, averaging 93.83% in the base game |
One rule holds across every row: the game information panel in a licensed Ontario lobby shows the RTP of the exact title you are about to open. Reading it takes a second, and it is the only figure that applies to the game in front of you. If you are still choosing an operator, our guide on how to choose an online casino in Ontario covers the checks that come before the games do.
How Ontario Casino Games Break Down by Category
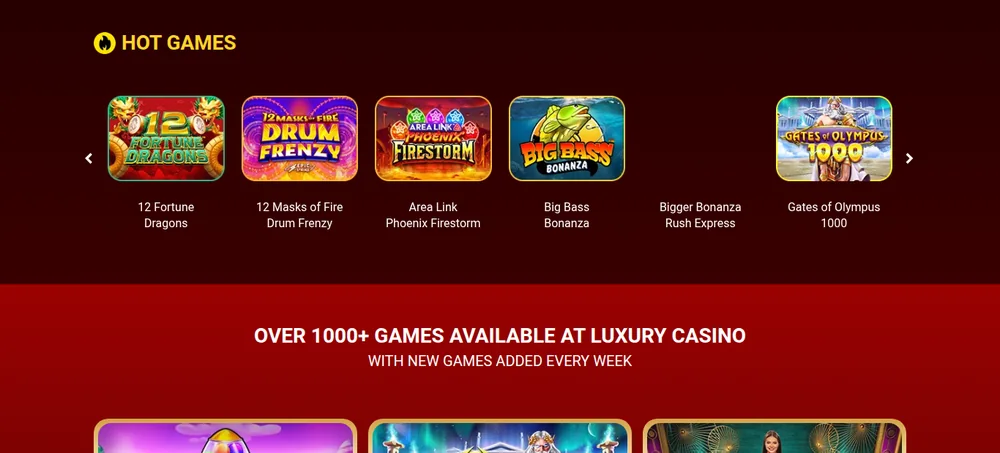
An Ontario lobby is roughly six parts slots to one part everything else. We read the catalogue feed of a licensed operator on the article date and classified all 6,064 titles by the family the platform itself assigns them. Each title appears once, so the column adds up.
| Family | Titles | Share | Average RTP | Median RTP |
|---|---|---|---|---|
| Slots | 5,211 | 85.9% | 93.70% | 94.00% |
| Blackjack | 380 | 6.3% | 99.04% | 99.28% |
| Live casino (baccarat, game shows, other tables) | 145 | 2.4% | 97.80% | 98.45% |
| Extra games | 120 | 2.0% | 94.48% | 94.20% |
| Live roulette | 70 | 1.2% | 97.21% | 97.30% |
| No family declared | 37 | 0.6% | 96.84% | 96.53% |
| Card games | 30 | 0.5% | 97.79% | 98.44% |
| Crash games | 28 | 0.5% | 95.02% | 94.95% |
| Roulette (software) | 22 | 0.4% | 97.27% | 97.30% |
| Video bingo | 16 | 0.3% | 92.88% | 94.59% |
| Video poker | 3 | 0.05% | — | — |
| Scratch cards | 2 | 0.03% | 87.10% | 87.10% |
| Total | 6,064 | 100% | 94.25% | 94.12% |
The two smallest shelves are worth a sentence each. There are three video poker titles and two scratchcards, and one of those scratchcards returns 80.00% — the lowest published figure of all 6,064 titles, below the worst slot on the shelf and nineteen points below blackjack. If you came looking for scratch tickets, what most Ontario players mean by that is the OLG’s paper INSTANT range, which is a lottery product and not part of the iGaming Ontario casino market at all.
Read the first and fourth columns together and the point makes itself: the family that occupies 85.9% of the catalogue returns the least, and the family that occupies 6.3% returns the most. Nothing here is hidden — every one of those RTP values is published by the operator. It is simply never presented side by side.
Slots: Most of the Lobby, Least of the Return
Slots are 5,211 of the 6,064 titles and average 93.70% RTP, which is a house edge of 6.30%. They dominate for reasons that have nothing to do with player value: they are cheap to licence, they need no dealer, and one studio can ship dozens a year.
The spread inside the category is wider than the average suggests. The weakest slot we counted publishes 86.70% and the strongest 98.79% — twelve percentage points apart, on the same shelf, at the same operator. Two players at the same lobby can be playing games whose long-run cost differs by a factor of six.
Sub-shelves are marketing labels rather than mechanical categories. Of the titles we counted, 188 carry the Megaways licence, 289 sit on a “Vegas” shelf and 39 are tagged as classic three-reel games. None of those labels tells you the return; the game information panel does, and it is one tap away in every licensed Ontario lobby. Our guide to online slots in Ontario lists the best games and the RTP each one publishes.
Blackjack: The Best Published Return in the Building
Blackjack averaged 99.04% across 380 tables, with a median of 99.28% and a best of 99.70%. Against the slot average of 93.70%, that is 5.34 percentage points — the house edge falls from 6.30% to 0.96%, roughly a sixfold difference in long-run cost.
Most of those tables are not software. Of the 380, 308 are streamed live tables with a human dealer, which is why blackjack and the live shelf keep producing the same numbers on this page.
The caveat matters as much as the number. Those RTP figures assume correct basic strategy on every hand; deviate, and the real return drops well below the published figure. Blackjack is the one category on this list where the number on the page is a ceiling you have to play up to, not a floor you get by default. Rule variations — how many decks, whether the dealer stands on soft 17, whether you may double after splitting — move the edge more than the choice of operator does. Our guide to online blackjack in Ontario sets out which rules to look for, table by table.
Roulette: The Wheel Decides, Not the Site
Roulette split into 70 live tables averaging 97.21% and 22 software wheels averaging 97.27% — statistically the same. What separates a good roulette table from a bad one is not the operator or the studio but the number of zeros on the wheel.
| Wheel | Pockets | House edge | RTP | Tables counted |
|---|---|---|---|---|
| French single-zero (with la partage) | 37 | 1.35% | 98.65% | 10 |
| European single-zero | 37 | 2.70% | 97.30% | 54 |
| American double-zero | 38 | 5.26% | 94.74% | 6 |
The 94.74% in the bottom row was the lowest roulette RTP in the entire catalogue, and it belongs to the American wheel. Choosing a French table over an American one on the same site cuts the house edge to roughly a quarter — and the two often sit side by side in the same lobby with near-identical thumbnails. The single most common table by far is the European wheel: 54 of the 92 we counted returned exactly 97.30%. Wheel by wheel, with the French rule that lowers the edge on even-money bets, it is all in our guide to online roulette in Ontario.
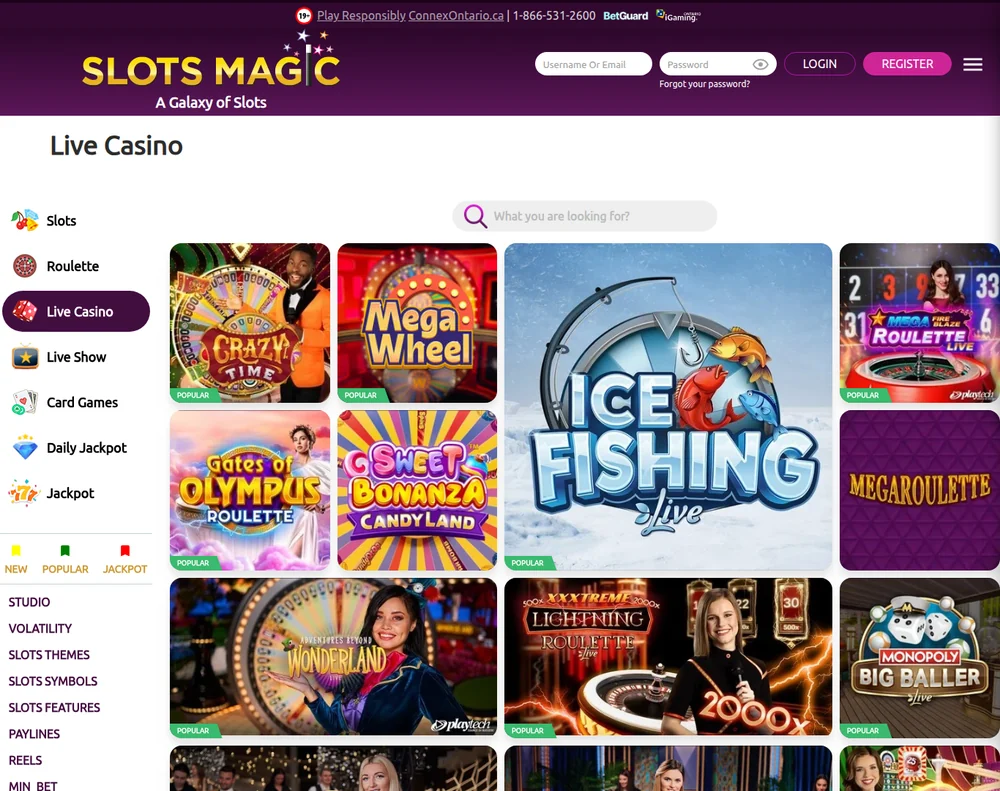
Live Dealer: 512 Tables, and Why That Is Not 145
We counted 512 titles flagged as live dealer — 8.4% of the catalogue — streamed from studios with a human dealer and a real wheel, table or shoe. As a group they returned 98.46%, the highest of any cut of this catalogue, because most of them are blackjack.
That is one catalogue. Across eleven Ontario lobbies we counted 4,568 live tables, from 714 at BET99 to 105 at FanDuel, and named the studios, game-show returns and stakes behind them in our guide to live casino in Ontario.
| Family the table is filed under | Live-dealer titles | Family total |
|---|---|---|
| Blackjack | 308 | 380 |
| Live casino (baccarat, game shows, other) | 113 | 145 |
| Live roulette | 60 | 70 |
| Card games | 18 | 30 |
| Other and unclassified | 13 | 42 |
| Total live dealer | 512 | 6,064 |
That table resolves the apparent contradiction: 145 is a shelf, 512 is a property, and the difference is 367 blackjack, roulette and card tables filed under their own game rather than under “live”. The trade-off in playing them is pace and cost of entry. The median minimum stake on a live table was $5.00 against $0.20 on a slot — twenty-five times higher — and the table runs at the dealer’s speed, not yours. Latency and data use are the practical constraints, so the live shelf is the one most worth testing on your own connection first; our notes on playing on mobile in Ontario cover what a streamed table costs in bandwidth.
Baccarat, Card Games and the Rest of the Table Floor
Baccarat appeared on 77 titles averaging 98.29%, other card games on 30 more, and video poker on just three. The table floor of an Ontario lobby is small in absolute terms but consistently sits between 97% and 99% return.
Baccarat is the least demanding game of the group: the banker bet carries a house edge of about 1.06% and requires no decisions at all beyond choosing which side to back. The tie bet, offered on the same table at eye-catching odds, is far more expensive and is the one bet on the baccarat felt worth avoiding. Sixty-five of the 77 baccarat titles are streamed live rather than played against software.
Video poker is the anomaly. Three titles in 6,064 is close to absent, which is a Canadian market pattern rather than an operator choice — the format never built the following here that it has in Nevada.
Game Shows and Crash Games: The Newest Shelf
Fifty-four titles carried a game-show flag and 28 were crash games, together under 1.5% of the catalogue. Both are recent formats built for streaming and for phones, and both behave differently from the games around them.
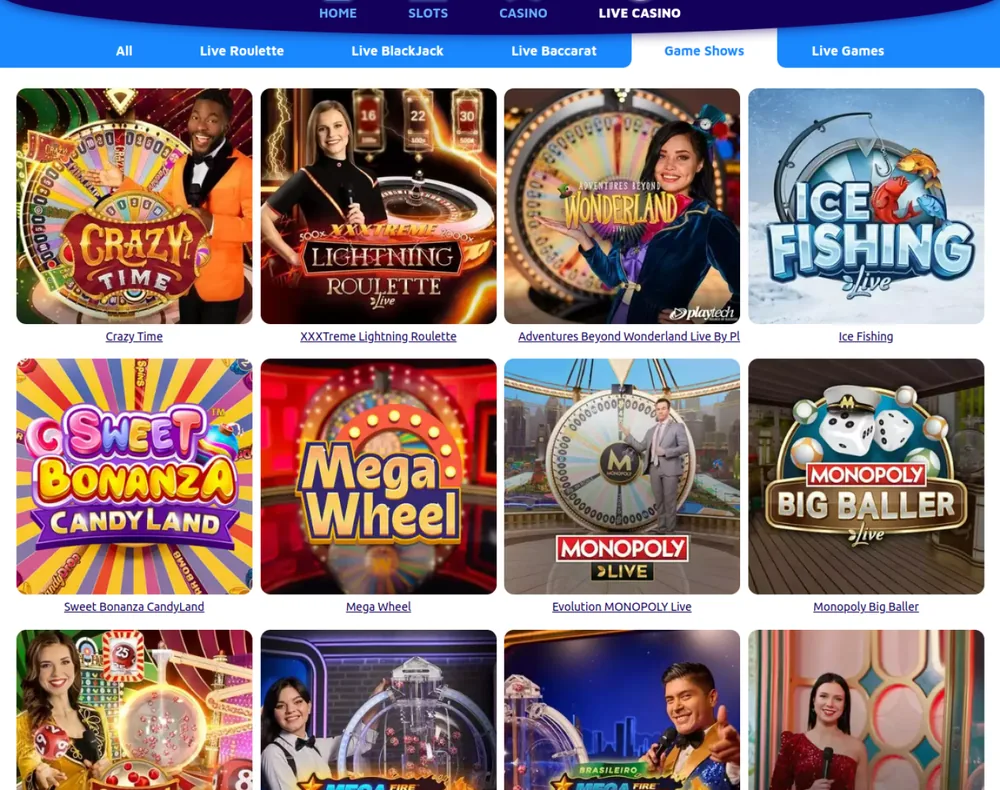
Game shows averaged 96.79%, and crash games 95.02% — between slots and table games. The crash structure, a multiplier that rises until it stops with the player choosing when to exit, gives the appearance of a skill decision while the outcome is decided before the round begins. On game shows the headline return also flatters the experience: the side bets that make them watchable carry the weakest returns on the table.
Jackpots: 132 Titles and the Hidden Cost
One hundred and thirty-two titles in the catalogue carried a genuine jackpot flag — 2.2% of the shelf, and all but one of them a slot. They averaged 93.83% in the base game. The prize pool is funded by a slice of every stake, which is why a progressive title usually returns less in normal play than the same studio’s non-progressive work.
Counting jackpots is also where operator data is least trustworthy. In an earlier count of a different Ontario catalogue we found the jackpot flag set on 922 titles, including European roulette and multi-hand blackjack, while the operator’s own progressive category held seven. We now count the category, never the flag — the method is described in how we review casinos.
What RTP Means, and What It Does Not
RTP is the share of all money staked that a game returns to all players over millions of rounds. Across the whole 6,064-title catalogue the average was 94.25% and the median 94.12%, with a range from 63.27% to 99.70%.
A 96% RTP does not mean that a $100 session gives back $96. It is a theoretical long-run figure calculated over an enormous number of rounds played by everybody, not a forecast for your evening. Any single session can land far above or far below it, and most land below, because a small number of large outcomes carry the average.
House edge is the same number seen from the other side: 100% minus the RTP. A game at 96% RTP has a 4% house edge. RTP describes what comes back to players as a group; house edge describes what the operator keeps. They are never in conflict, and the second is usually the more honest way to read the first.
| RTP | House edge | Long-run cost per $100 staked | Typical category |
|---|---|---|---|
| 99.28% | 0.72% | $0.72 | Blackjack, correct strategy |
| 98.65% | 1.35% | $1.35 | French roulette, la partage |
| 97.30% | 2.70% | $2.70 | European roulette |
| 96.00% | 4.00% | $4.00 | Above-average slot |
| 93.70% | 6.30% | $6.30 | Catalogue slot average |
| 86.70% | 13.30% | $13.30 | Weakest slot counted |
The third column is the one to internalise, with one warning attached: it describes total money staked, not money deposited, and a balance recycled through a game is staked many times over. A $100 deposit played through a slot ten times has staked $1,000. Which casinos install the higher-paying version of each game is the subject of our page on the best paying online casinos in Ontario.
Volatility: The Number Almost Nobody Reads
Volatility describes how a game delivers its return: in frequent small amounts or rare large ones. Two games with identical RTP can feel completely different, and the catalogue we counted skews heavily to the punishing end.
- Low — returns arrive often and small. The longest sessions for a given bankroll, and the least dramatic.
- Medium — a mix; the default setting of most catalogues.
- High — long stretches return nothing, then an outsized round. The balance moves in steps, not in a line.
- Very high — the return concentrates in rare outcomes, so most rounds give back nothing at all.
| Volatility rating | Titles | Share of catalogue |
|---|---|---|
| High | 2,594 | 42.8% |
| Medium | 1,728 | 28.5% |
| Medium-High | 1,040 | 17.2% |
| Low | 268 | 4.4% |
| Very High | 165 | 2.7% |
| Not rated | 269 | 4.4% |
Forty-five per cent of the catalogue is rated high or very high, against 4.4% rated low. The obvious assumption is that the punishing games pay more to compensate. We tested it against the slot titles that publish both a rating and an RTP, and they do not.
| Slot volatility | Titles measured | Average RTP |
|---|---|---|
| Low | 234 | 94.22% |
| Medium-High | 767 | 94.18% |
| High | 2,440 | 93.65% |
| Very High | 156 | 93.37% |
| Medium | 1,413 | 93.47% |
The low-volatility slots returned more than the very high ones — 94.22% against 93.37%. Volatility is not a probability of winning and it is not a payout multiplier: it only changes how the same return is distributed over time. A bankroll that lasts an evening on a low-volatility game can be gone in minutes on a very high one at the same stake, for the same money back in the long run.
Demo Mode: Two Thirds of the Catalogue Runs Without Money
Of the 6,064 titles, 3,964 — 65.4% — were flagged as playable in demo mode without a deposit. That is the cheapest way to test whether a game suits you before any money is involved, and it is not spread evenly across the shelves.
| Shelf | Playable in demo | Share of the shelf |
|---|---|---|
| Video bingo | 13 of 16 | 81.2% |
| Roulette (software) | 17 of 22 | 77.3% |
| Extra games | 90 of 120 | 75.0% |
| Slots | 3,726 of 5,211 | 71.5% |
| Crash games | 16 of 28 | 57.1% |
| Live roulette | 15 of 70 | 21.4% |
| Live casino tables | 18 of 145 | 12.4% |
| Blackjack | 42 of 380 | 11.1% |
The pattern in that table is not arbitrary. Live dealer tables cannot run in demo because there is a real dealer and a real table on the other end, and progressive jackpot titles are usually excluded because the prize pool needs real stakes. So the shelves that return most and the shelves that pay the biggest prizes are precisely the ones you cannot try for nothing. Demo mode also reproduces the mathematics but not the psychology: a losing streak with no money at stake teaches you the game’s rhythm, not how you will behave when the balance is real.
Who Actually Makes the Games
Seventy-eight studios were represented in the catalogue, but the distribution is heavily concentrated: the ten largest supplied 51% of all titles.
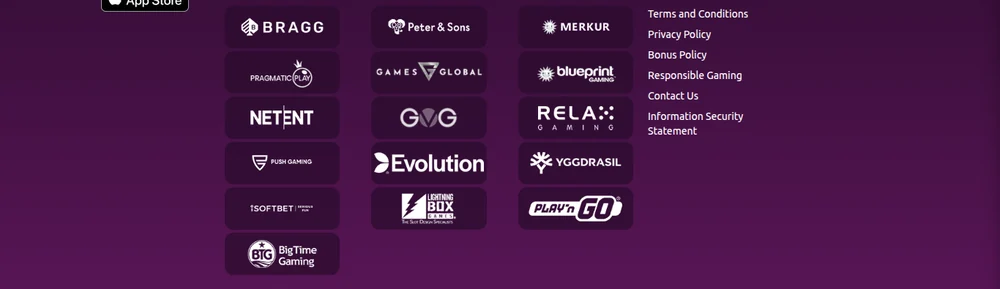
| Studio | Titles | Known for |
|---|---|---|
| Games Global | 872 | Long back-catalogue, progressive network |
| Pragmatic Play | 644 | High-volatility slots, live tables |
| Playtech | 465 | Branded slots, live studio |
| Play’n GO | 382 | Consistent mid-volatility slots |
| Evolution | 337 | Live dealer and game shows |
| Red Tiger | 228 | Daily-drop mechanics |
| Relax Gaming | 211 | High-volatility originals |
| Blueprint Gaming | 209 | Megaways licensees |
| Wazdan | 182 | Adjustable volatility settings |
| Hacksaw Gaming | 178 | Short-format, very high volatility |
Because studios supply many operators at once, the same games recur across lobbies. Catalogue size therefore says far less about a site than it appears to — three Ontario brands we checked returned the identical figure of 6,064 titles because they draw on one shared library.
Why Catalogue Sizes Do Not Compare
Five of the 51 registered brands we review on the iGaming Ontario register have no single game total on record — BetMGM, bwin, DraftKings, PointsBet and Royal Vegas, which publishes four different figures — and the ones that do are not counting the same thing. The figures we hold range from “hundreds” at Ruby Fortune and Spin Casino and “400+” at Jackpot City to 6,204 counted at Knightslots.
| What the number usually includes | Effect on the total |
|---|---|
| Every jurisdiction the platform serves | Inflates — Ontario sees fewer |
| Each roulette or blackjack table as a title | Inflates heavily |
| Duplicate listings across shelves | Inflates |
| Live dealer tables excluded | Deflates |
| Ontario-licensed titles only | The only comparable basis |
The practical consequence is that “more games” is close to meaningless as a reason to choose one site over another. Composition, minimum stakes and how fast the site pays are the differences that hold up — the last of those is covered in our guide to fast-withdrawal casinos.
Where to Play These Games in Ontario
Picking the game comes first, picking the site comes second, and the two decisions use different evidence. Once you know which shelf you want, the questions that remain are about the operator: whether it is on the register, how quickly it pays, and how it behaves on a phone. If you would rather start with the operators that opened most recently, we keep a separate page on recently launched Ontario casinos.
- Best online casinos in Ontario — our ranking of the 51 registered casinos, with the games each one carries.
- Casino payment methods in Ontario — what each method costs and how long it takes.
- Fastest withdrawals — measured payout times, not advertised ones.
- Best casino apps in Ontario — which operators ship a real app and which wrap the website.
- Legal online gambling in Ontario — how the AGCO and iGaming Ontario framework works.
We are working through this catalogue shelf by shelf. Four of those pages are live: our guide to online blackjack in Ontario counts all 380 tables by variant, studio and table minimum, our guide to online slots in Ontario counts all 5,215 by studio, volatility and published return, our guide to online roulette in Ontario counts all 92 tables and tests every published RTP against the arithmetic of the wheel, and our guide to online baccarat in Ontario counts all 88 tables and shows which of the three bets each published figure describes. Live dealer tables follow.
How We Counted This
For this article we tested the catalogue feed that a licensed Ontario operator uses to populate its own lobby, and read all 6,064 entries in pages of 100. Every figure on this page comes from that count or from the operator’s published game data — none of it is estimated.
Each entry carries its family, category tags, studio, published RTP range, volatility rating, minimum stake and flags for live dealer, jackpot and demo availability. We aggregated by family and by flag.
The five entries we dropped. Five of the 6,064 publish no usable RTP: three carry no value at all, and two report 926.00 and 945.00 — figures recorded on a per-thousand scale instead of a percentage. Four of the five are slots, so the slot average of 93.70% is computed over 5,207 titles rather than 5,211. No other figure on this page is affected, and none of the five is excluded from the title counts.
The limitation, stated plainly: this is one catalogue, shared by three brands that returned the identical total of 6,064. It is a large and representative Ontario library, but it is not the whole market, and an operator running a different platform will have a different mix. A second read of the same feed later the same day returned 6,066 — two slots added in a few hours. Counts age by the day, which is why the update date at the top of this page matters.
Our full process, including how we weight games against payments and support, is set out in how we review casinos. Every operator mentioned on this page is registered with iGaming Ontario and licensed by the AGCO under the Registrar’s Standards for Internet Gaming; we list only sites that appear on the iGaming Ontario register.
Playing These Games Responsibly
19+. You must be physically located in Ontario to play. Gambling should be entertainment, not income — free, confidential support is available around the clock from ConnexOntario on 1-866-531-2600. Our responsible gambling guide for Ontario covers the deposit limits, time-outs and BetGuard self-exclusion that every registered operator must provide.
One point follows directly from the numbers above. No category on this page returns more than it takes: the best average return we measured was 99.04%, which is still a cost, and the catalogue average of 94.25% is a cost of $5.75 for every $100 staked. Games are priced entertainment, and the RTP column is the price list.
Frequently Asked Questions
Which casino game has the best odds in Ontario?
Blackjack. Across the 380 tables counted for this article, the average published return was 99.04%, against 93.70% for slots. That return assumes correct basic strategy on every hand; play by instinct and the real figure falls well below it.
How many casino games do Ontario sites offer?
One licensed catalogue we counted held 6,064 titles, of which 5,211 were slots. Counts are not comparable between operators, though: five of the 51 registered sites we cover have no single figure on record, and those that do count different things.
What does RTP mean on a casino game?
RTP is the percentage of all money staked that a game returns to players over millions of rounds. A 96% game costs $4 per $100 staked in the long run. It describes averages, not sessions, and it appears in every licensed game’s information panel.
Do high-volatility slots pay more?
No. We measured 5,010 slots that publish both figures: the low-volatility ones averaged 94.22% and the very high ones 93.37%. Volatility changes how the return is spread over time, not how much of it comes back.
Can I try casino games without depositing in Ontario?
Most of them, yes. We found 3,964 of 6,064 titles — 65.4% — playable in demo mode without money. Live dealer tables and progressive jackpot games are the usual exclusions, because both need real stakes to run.
Are online casino games in Ontario fair?
Games at operators on the iGaming Ontario register are tested by accredited independent laboratories and must meet the AGCO’s technical standards. That is a check on the game’s mathematics, not a guarantee of winning — the published RTP still applies.